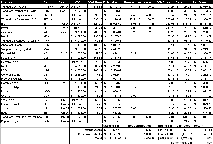
March Investment Performance (-1.85%)
This is the first of hopefully an ongoing monthly update on how my equity investments are performing. Please see this background on the investment tool I developed and how I am using it to track my performance against a benchmark to measure our progress or lack thereof.
Its still a work in progress, any feedback is appreciated and may be incorporated into future monthly reports. The only equity investments not covered are:
1) my 401k which is invested in institutional index funds through my employer that I haven't found a tracking symbol for.
2) investments roughly worth less than $500, simply because I don't have the time and energy to keep up with them. I am thinking I will sell these off at some point and add the proceeds to my current investment portfolio because they are too much work to track.
March Highlights:
- Invested $650 into the Vanguard Total Stock Market Index (VTI). This is part of my effort to focus more attention on low cost index investments until I can prove our active investment strategy is making sense.
- We increased our position in Wachovia (WB) which has continued to decline. Given our long term investment horizon I still think we have a good long term financial investment although I have been second guessing ourselves that we should have be investing in a financial index (such as KBE) instead of one company that has been especially volatile the past couple months. Now that the capital ratios have been addressed, I am expecting the investment to be less volatile going forward.
- Remaining investments have be part of our ongoing monthly investments - Pfizer DRIP ($50), IBM ESPP (payroll deductions), and Roth IRA ($1050) contributions for my wife and I. Pretty self-explanatory.
- -IBM has continued to perform well. I have gotten in the habit of selling some of our IBM investment each year during the summer since we have monthly investment contributions through my ESPP so that we don't become super-overweight in IBM. I'll be looking to sell off another block hopefully around July.
- Johnson & Johnson, Chevron, ConoccoPhilips, ExxonMobil, Anheuser Busch, Wachovia, Pfizer, and IBM all paid dividends this month. All but IBM had their dividends reinvested.
March 2008 Investment Report:

Related in Stocks:
Chairmen Letters to Shareholders (Mar 09, 2014) Its that time of year again --the close of fiscal years means an overload of annual reports including Letters to Shareholders. Two annual letters that I read each year are those from Berkshire Hathaway (Warren Buffet) and Fairfax Financial (Prem...
Investment Performance January 2014 (-2.94%) (Feb 23, 2014) January 2014 Investment Report: January Highlights: January was a bad way to start out the year, but our portfolio performed slightly better thank our benchmark (-2.94% vs -3.17%). We made our regular monthly investments in our Roth IRAs, and some...
Investment Performance December 2013 (+2.20%) (Jan 10, 2014) December 2013 Investment Report: December Highlights: December was another subpar for us as our portfolio performed poorly compared to our benchmark (+2.20% vs +2.58%). We made our regular monthly investments in our Roth IRAs, and some dividends & dividend reinvestments....


Comments (5)
Excel is very manual, but if you add columns for geography (US, EAFE ex US, Emerging Mkt), market cap (large, mid, small), and asset class (EQ, FxInc, RE, MMkt), then you can pivot your table and see balances sliced and diced into different major investment categories.
You can set up the 3 or 4 pivots in advance so that when you update you generate the broad allocations.
That way you know what to buy next to fill out your target asset allocation.
Posted by ETFnerd | April 18, 2008 4:13 PM
2mil - I love your quote "...until I can prove our active investment strategy is making sense"
The fact that your porftolio performed 23% worse than your benchmark shows that this could be a long wait.
Posted by CPA1298 | April 18, 2008 6:16 PM
I this is a good start...but am a little lost here...how do these numbers tie back to your monthly net worth line items? These are much lower...see March update where you have ~75k taxable brokerage accts, ~156k pre-tax ret. accts, ~38k ESPP, etc. Can you explain the differences?
Posted by Anonymous | April 19, 2008 6:48 PM
Anon - great question. Should have clarified this earlier. These investments are covered by RothIRA, Taxable Investment Accts, ESPP, and a small amount of our pre-tax retirement accts on our net worth statements. As I mentioned before my 401k is excluded at this point, so just my sep ira is included from our pre-tax retirement accts.
So for example in March:
Roth IRA: ~38k
ESPP: ~38k
Taxable Accts: ~$75k
Portion of our pre-tax retirement: $~2k
Total: ~$153k for March
Posted by 2million | April 19, 2008 9:14 PM
Great blog mate, I really like the approach you take with showing your real info and excel spreadsheets...
Posted by James Cox | April 20, 2008 8:47 AM